
Data analytics that answers the questions your managers actually ask
Every business collects data. Few can answer simple questions with it quickly: which products make money, where production slows down, which customers are at risk. We build the pipelines, models and dashboards that make those answers routine.
Analytics for Pakistani companies. Most of our analytics clients start with spreadsheets, ERP exports and distributor reports. We consolidate them into one database, build dashboards owners actually read, and automate the monthly reports that currently take days. Typical users: exporters tracking orders and margins, distributors tracking sales by territory, manufacturers tracking production and wastage, and solar operators tracking generation through Force-V.
Services
- Data pipelines and warehousing: consolidate data from apps, spreadsheets, devices and third-party systems into one clean, documented store
- Business intelligence dashboards in Power BI, Metabase or custom React interfaces, designed around decisions rather than tables
- Reporting automation: scheduled reports by email, Slack or WhatsApp that replace manual monthly compilations
- Descriptive and diagnostic analytics: what happened and why, with drill-downs by product, region, team or time
- Predictive analytics: demand, churn, maintenance and revenue forecasts using statistical models and machine learning
- Prescriptive analytics: optimization models that recommend prices, stock levels or schedules

What clients gain
Better insight into customers
Segment by behaviour and value, spot churn early and see which channels bring profitable customers.
Operational efficiency
Find bottlenecks in production, delivery or support with time-stamped data instead of anecdotes.
Process automation
Replace manual report assembly with pipelines that run on schedule and alert you when numbers move.
Product decisions
Measure feature usage and outcomes so product and promotion decisions rest on evidence.
Lower costs
Cut waste, over-stocking and unprofitable activity once they are visible.
Market intelligence
Combine internal data with external signals such as prices, weather or demand indices.
Example: energy analytics at five-minute resolution
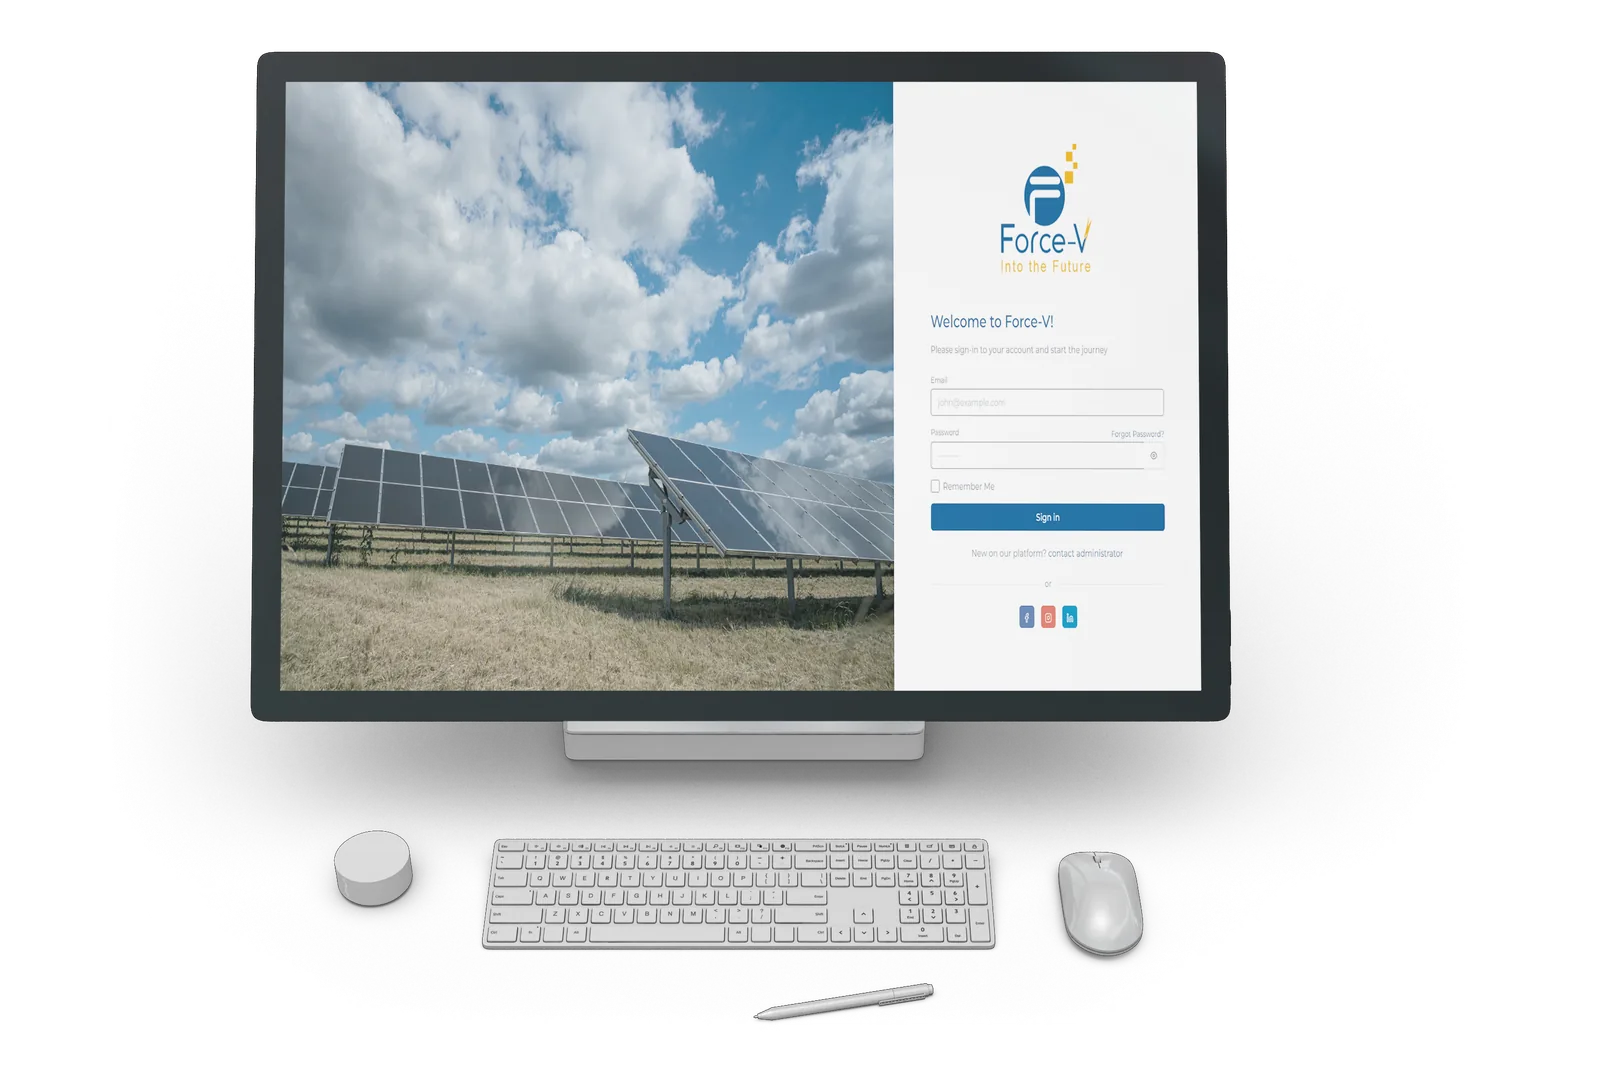
For Force-V we ingest readings from solar plants over MQTT, store them in a time-series friendly schema and serve dashboards that aggregate production from five-minute intervals up to yearly totals, alongside environmental impact and grid export economics. The same architecture applies to factories, fleets and retail networks.
Tools we work with
Frequently asked questions
We only have spreadsheets. Is that enough to start?
Yes. Most analytics projects start by consolidating spreadsheets and exports into a single database. We clean and model the data, then build dashboards on top. You keep using the tools you know while the pipeline runs behind them.
Which dashboard tool do you recommend?
Power BI for Microsoft-centric teams, Metabase for a low-cost self-hosted option, and custom React dashboards when the interface is part of a product. We are happy to work inside a tool you already pay for.
How do you keep our data secure?
Data stays in your accounts and servers wherever possible, access is role-based and logged, transport is encrypted and we sign confidentiality agreements as standard.
Can you connect to our ERP, POS or IoT devices?
Usually. We have integrated with ERP databases, payment and POS exports, accounting packages and MQTT device streams. If a system has an API or a database, we can work with it.
Tell us about your project
A 30-minute call is enough to scope most projects. We reply within one business day.